What is CHARM™?
Community Health And Resource Management™
—
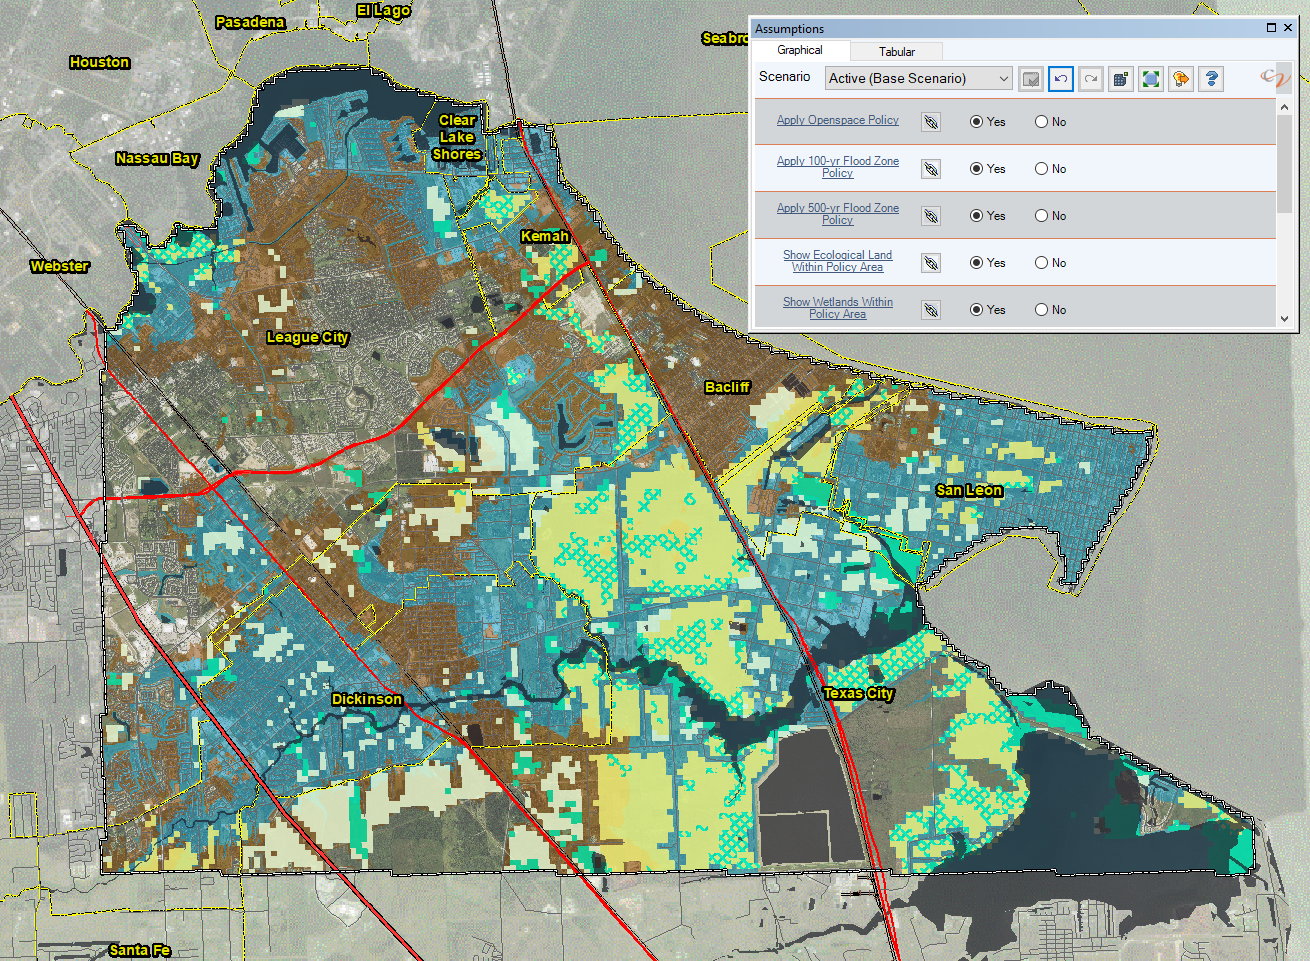
A mapping application that gives local officials, stakeholders, and citizens the power to map and analyze growth with real-time feedback. When used with the weTable, it forms a powerful planning tool for engaging the public and gathering their values about the community’s future. The mapping application is supported with a library of mapping data about urbanization, storm surges, conservation, public facilities, and coastal resources. The CHARM application can leverage local community knowledge for better long-term planning, and is an ideal tool for communities, watersheds, and environmental projects along the U.S. Gulf Coast.
2.5 ACRE GRID
The interactive CHARM grid layers summarizes 24 land-based characteristics and over 40 scenario-based attributes.
20+ MAPPING LAYERS
CHARM gathers mapping layers from federal, state, and regional agencies to inform users on impacts.
24 PAINTS
Users can build scenarios using over two dozen paints. Each representing a range of development land patterns and usage.
10+ ASSUMPTIONS
CHARM has the ability to modify certain assumptions about housing, the environment, and costs.
50+ CHARTS
Scenario outputs feature quick updates using over 50 charts and graphs to illustrate changes.
250+ INDICATORS
CHARM tracks over 200 scenario-based indicators about changes or impacts in a community. From habitats to resource use to critical facilities.


